

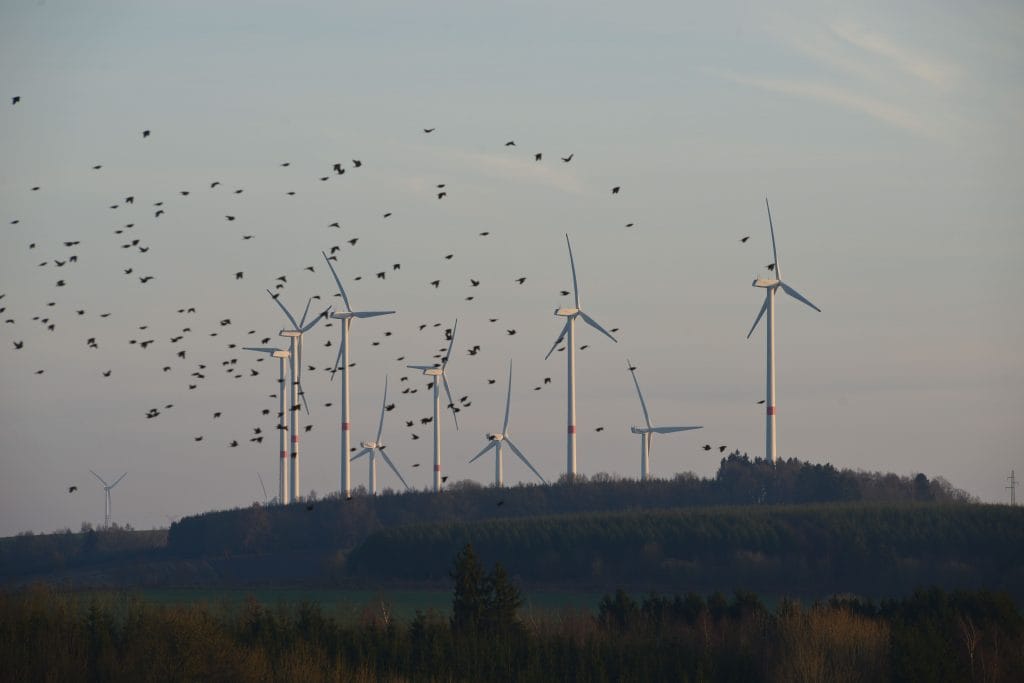
Wind energy is essential for moving away from fossil fuels. While wind turbines are seen as a symbol of a cleaner future, there has always been a legitimate and obvious concern: their impact on wildlife, particularly birds and bats. However, the question is: are we approaching the challenge in the right place?
A recent study by TAXUS MEDIO AMBIENTE shows that the problem is much more complex than the simple collision of a bird against a windmill. The real scientific challenge is to understand the cumulative effect of dozens of wind farms operating in the same region.
Here, the combined impact can be greater than the simple sum of its parts, creating risks that are difficult to foresee. The reason? Each project is, in practice, an island of information: lots of valuable data, but isolated and in different formats. How can we effectively protect wildlife if we don’t even see the whole map?
The real challenge is not a wind turbine, but the entire “landscape”.
When we think of risk, we tend to imagine a single wind farm. However, technical teams are dealing with something much more complex: cumulative and synergistic effects. Simply put, it’s not just one farm that matters, but how several combine in the same region and how they interact with the flight paths of birds and bats.
Assessing this overall risk is very difficult. The main obstacle is the lack of comparable data from neighboring parks. Without such information, each new project is assessed almost in a vacuum: its immediate surroundings are well studied, but it is difficult to understand how it fits into the existing infrastructure “ecosystem” and what effect it will have on large-scale wildlife movements.
The decisive metric: it’s not whether a bird flies close, but how long it stays in danger.
To calculate the probability of a bird colliding with a blade, TAXUS ENVIRONMENT works with a clear definition of “risk zone“. Technically, it is the volume generated by the rotation of the blades in a 360-degree turn, in any of its orientations.
Generically, it is considered a risk zone:
- Space within 200 meters of a wind turbine
- And at a height of between 15 and 200 meters above the ground.
We might think that it is enough to count how many birds enter this volume, but the most critical and revealing parameter is another: the time in the risk zone.
A bird that crosses this space in an instant is not the same as a bird that circles the rotor for several minutes. This exposure time is what really determines the probability of collision. The problem is that it is precisely this data that is most often missing in many studies, which complicates risk estimates.
A methodological note: what is actually measured in the field
The work of TAXUS MEDIO AMBIENTE is not only about “pointing birds”. For each sighting in the specific follow-ups are recorded, as a minimum:
- date
- sampling point
- number of individus
- species
- habitat
- distance to the wind turbine
- flight altitude
- and, when possible, time in the risk zone.
It is with this well-designed and standardized information that a solidly based collision risk model can be fed.
The William Band model
All this logic is supported by William Band’s collision model, an international reference methodology for estimating collision risk in wind farms. In its complete formulation, the model is applied in several phases (how many birds occupy the risk zone, probability of being hit by a blade, actual probability of collision per year) and takes into account parameters such as:
- number of blades
- rotational speed
- rotor geometry
- bird flight speed
- size and type of flight (glider or non-glider)
This model has been used in the study, adapted to a current average wind turbine (120 m high and 172 m rotor diameter), to translate the times in the risk zone into estimated mortality per wind turbine and per sighting.
The result boils down to something very practical: a mortality factor (m) that serves as a “bridge” between the field data and the probability of collision.
The lost treasure trove of data: information that exists but no one sees
With the boom in renewable energies, an enormous amount of data is generated every year on avifauna and bats in Spain. Each Environmental Impact Study involves annual cycle inventories, environmental monitoring, mortality tracking… In other words, there are thousands of records on how these species use the airspace.
And yet, almost all of this information is not publicly accessible.
The paradox is clear: these data are collected because the law requires it to protect the general interest, but then they remain fragmented and privatized, in the hands of multiple consulting firms and developers, with no common system for sharing them. If they could be brought together in accessible and well-standardized databases, we could build much more accurate predictive models and make better-informed decisions about where and how to build new parks.
The solution: create a regional risk “translator”.
In this case, we analyzed internal data collected between 2020 and 2023 at 19 renewable energy facilities in the northwestern peninsular, all with full annual cycle monitoring of avifauna. From these data, the species that spend most time in the risk zone (and, therefore, more sensitive to collisions) were selected:
- Golden eagle(Aquila chrysaetos)
- Griffon vulture(Gyps fulvus)
- Red Kite(Milvus milvus)
- Black Kite(Milvus migrans)
- Buzzard(Buteo buteo)
Faced with this lack of shared and homogeneous data, TAXUS MEDIO AMBIENTE proposes an intelligent approach: instead of waiting for the perfect database for all of Spain, we start by making the most of what we do have:for each one of them we calculated the average time spent in the risk zone per installation, and then we obtained a regional average. These values were entered into Band’s model to obtain the estimated mortality per wind turbine and sighting (m). The result is the following table of average time spent in the risk zone for a small region of the northwestern peninsular:
Species | Average dwell time in risk zone (seconds/sighting) | Estimated mortality (m) |
Golden eagle(Aquila chrysaetos) | 49 | 0,011 |
Griffon vulture(Gyps fulvus) | 52,5 | 0,013 |
Red Kite(Milvus milvus) | 47,8 | 0,009 |
Black Kite(Milvus migrans) | 58,5 | 0,010 |
Buzzard(Buteo buteo) | 47,4 | 0,008 |
It is important to emphasize that these values are regional: they represent the average behavior observed in that particular area of the northwestern peninsular. For other regions, with other habitat conditions, orography or wind regime, it would be necessary to recalculate them with similar local data.
How to use this “translator” in a new park
From this table, it is now possible to make a reasonable estimate of the risk of collision at a new wind farm in the region, even if it has not been possible to measure in detail the time spent in the risk zone at that wind farm.
The formula is very simple: Estimated Mortality = N – n – m
where: N = number of wind turbines in the farm, n = number of sightings of the species considered in the monitoring, m = estimated mortality per wind turbine and sighting, taken from the table above.
Thus, Band’s model, which in its complete version is quite complex, is translated here into an operational tool that is very easy to apply in synergistic studies.
However, the study itself reminds us that this extrapolation has limitations. Changes in the use of airspace by birds, differences in habitat, elevation or meteorology between parks may mean that the behavior in one area is not exactly the same as in another. Therefore, these tables should be understood as an informed approximation within a specific regional area, not as a universal value valid everywhere.
Not all birds (nor all bats) behave the same in the face of danger. The above table not only gives us a calculation tool; it also reveals something fundamental: each species has its “way of being in danger”.
The Black Kite is the species that, on average, spends the most time in the risk zone (58.5 seconds per sighting), which increases its potential exposure.
The Buzzard and Red Kite have the lowest mean times within the group analyzed.
These differences show that we cannot treat all birds (or all chiropterans) as if they behave the same. Truly effective protection requires understanding how each species uses airspace: flight height, time in the risk zone, gliding patterns, etc.
Conclusion: towards smarter wind energy… and fairer to biodiversity
This work leaves a clear lesson: the potential to better protect biodiversity in the age of renewables lies not only in collecting more and more data, but in standardizing, sharing and using it intelligently.
The study proposes three very specific lines of action:
- Standardize the data collected in the field, including as a minimum the flight altitude and the time in the risk zone.
- Also take advantage of parks in operation, systematically compiling observed mortality and basic parameters of sightings in environmental monitoring.
- To move towards accessible databases and the preparation of regional tables of average permanence in risk zones, which will serve as support for sensitivity maps and synergistic evaluations.
The tools and models – such as Band and average permanence tables – already exist and work. What is missing is to make the leap to a more collaborative and open system, where the environmental data that is collected to protect the general interest can actually meet that objective.
As we race to build a clean energy future, an uncomfortable but necessary question remains: In addition to wind turbines, are we willing to also build the collaborative and open data infrastructure we need to protect the species that share that future with us?


